
Our considerate iOneCloud team has gathered some essential support documentation and the most frequently asked questions we receive about our technology solutions. Also find information on how to get easily started with your iOneCloud Elastic Cloud Server and cPanel platform.
Get Started with iOneCloud
Frequently Asked Questions
Support Documentation
Get in Touch
Get Started with iOne Cloud
Interested in the cloud transformation of your business operations with what iOneCloud has to offer? Our Elastic Cloud Solutions will elevate how you work.
Get Started with iOneCloud
Frequently Asked Questions
iOneCloud prides itself with providing our clients 24/7 courteous customer service. Our frequently asked questions section should provide answers for the most common occurrences with your Elastic Cloud and cPanel Web Hosting solutions. Don’t hesitate to get in touch should you need further assistance.
Elastic Cloud Server
Find answers to the most common questions with your Elastic Cloud Servers.
An Elastic Cloud Server (ECS) is a basic computing unit that consists of vCPUs, memory, OS, and Elastic Volume Service (EVS) disks.
After creating an ECS, you can use it on the cloud like using your local PC or physical server.
The Elastic IP (EIP) service enables you to use static public IP addresses Internet bandwidths to connect your cloud compute to the Internet.
A security group implements access controls for ECSs, specifying the communication scope of ECSs. We can define different access control rules for a security group, and these rules take effect for all ECSs added to this security group.
By default, a security group allows all data packets that are sent out from ECSs in it, and ECSs in the same security group can access each other.
A virtual private cloud (VPC) is a secured, isolated, logical network environment. You can create virtual networks in a VPC. The virtual networks provide the same network functions as those provided by a physical network and also advanced network services, such as elastic IP addresses and security groups.
After successful payment, your iOneCloud Server will be created and handed over within just 30 minutes.
cPanel Web Hosting
Find answers to the most common questions with your cPanel Web Hosting platform.
cPanel is a convenient management platform with essential website creation and file editing tools.
Start your website hosting journey with the Internet’s most widely used control panel.
Support Documentation
Below section contains support documentation for your Elastic Cloud Server and/or cPanel platform. Don’t hesitate to get in touch should you need further assistance. iOneCloud prides itself with providing our clients excellent customer service.
Elastic Cloud Server
Find helpful support documentation for your iOneCloud Elastic Cloud Server in this section.
I. Introduction
In this guide, we are going to configure SSH to use a different Port on Ubuntu 20 to 24 versions. Even though configuring SSH Server to listen on a different port other than the default port, 22 may not gain you much from security point of view. Therefore, we need to change SSH port to make it more secured.
II. Configure SSH to use a different Port on Ubuntu 20 to 24 versions
This scenario, we are going to change port number from “22” to “1155“.
– We have to login to our server and open the OpenSSH server configuration file “/etc/ssh/sshd_config” for editing by using command:
$ sudo vi /etc/ssh/sshd_config
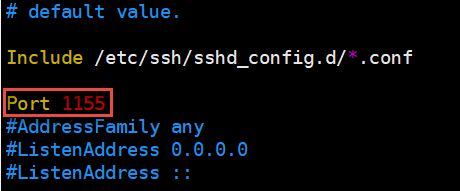
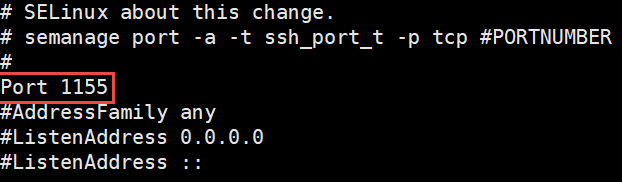
– Uncomment the line “# Port 22” and set it to a desired port “1155”
Note:
– Ensure that no other service is using the new port
– Ensure that the new port is not conflicted to other service ports
– Replace the ports accordingly.
III. Adjust Firewall for SSH Port
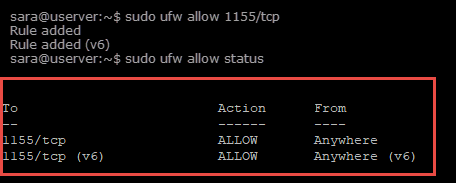
To allow SSH port in firewall
$ sudo ufw allow 1155/tcp
To check firewall status and Restart “sshd” Service
$ sudo ufw status
$ sudo systemctl restart sshd
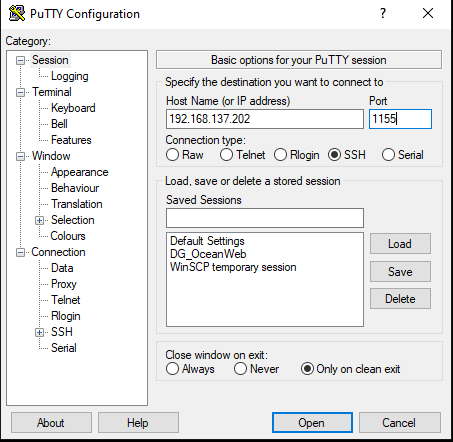
V. Test Remote with New Port
We use Putty to test remote with new “port= 1155” with our IP Address of Server.
Server is successful accessed
I. Introduction
In this guide, we are going to configure SSH to use a different Port on Alma Linux. Even though configuring SSH Server to listen on a different port other than the default port, 22 may not gain you much from security point of view. Therefore, we need to change SSH port to make it more secure.
II. Configure SSH to use a different Port on Alma Linux
This scenario, we are going to change from “22” to “1155“.
– We have to login to our server and open the OpenSSH server configuration file “/etc/ssh/sshd_config“ for editing.
# vi /etc/ssh/sshd_config
– Uncomment the line, # Port 22 and set it to a desired port “1155“
Note:
– Ensure that no other service is using the new port
– Ensure that the new port is not conflicted to other service ports
– Replace the ports accordingly.
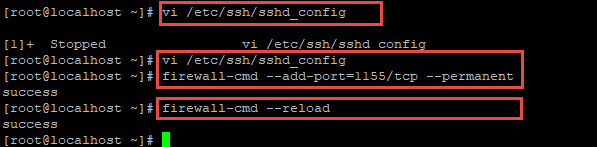
III. Adjust Firewall and SELINUX for SSH Port
– To allow SSH port in firewall on CentOS Linux Server:
# firewall-cmd --add-port=1155/tcp --permanent
# firewall-cmd --reload
– To Adjust SELINUX on Alma Linux Server
# semanage port -a -t ssh_port_t -p tcp 1155
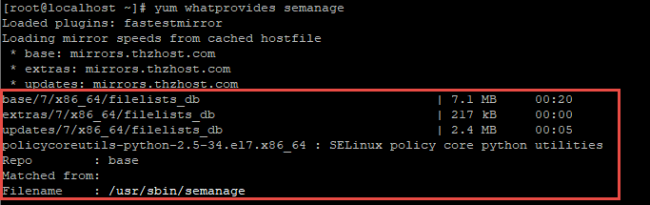
– If “semanage” command is not found, check which package provides “semanage” and install that package:
# yum whatprovides semanage
# yum -y install policycoreutils-python
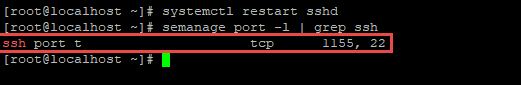
– Restart SSH Service and Reify port
# systemctl restart sshd
# semanage port -l | grep ssh
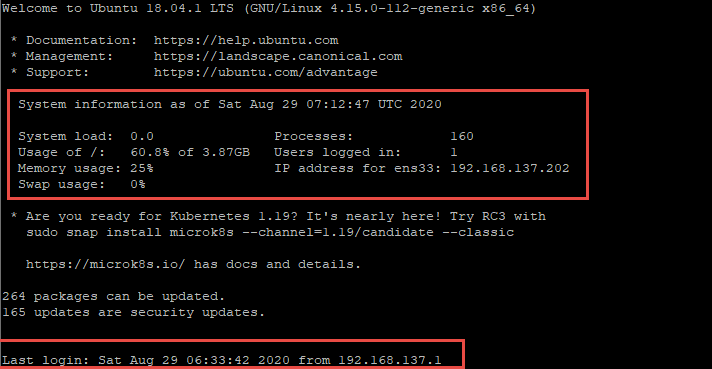
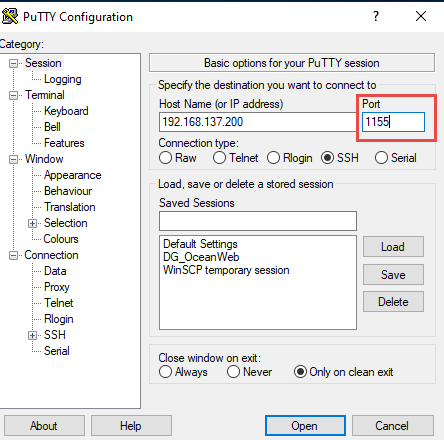
IV. Test Remote with New Port number
We use Putty to test remote with new “port number:1155“ with our IP Address of Server
1. Putty Interface
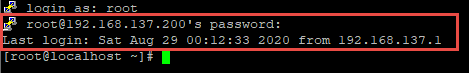
2. successful login with new port number
I. Introduction
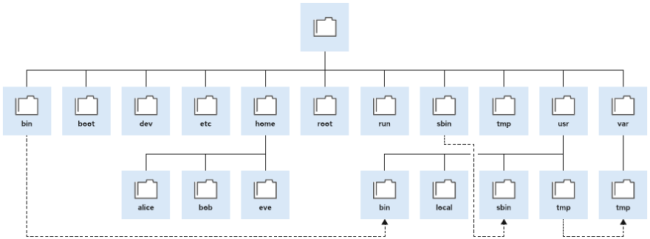
The “root“ partition takes its name from the fact that it is the partition mounted at the root of the Unix/Linux file system, which is the directory known as “/“. A file system must be mounted on this directory to successfully boot a Linux enterprise system.
II. Processing and Scenario
This scenario is processing on Ubuntu Linux Server 18.04 that has root partition 50GiB, and we are going to extend this partition to 100 GiB.
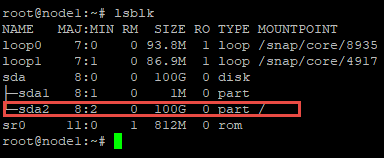
To show detail partition storage show block of petitions:
# lsblk
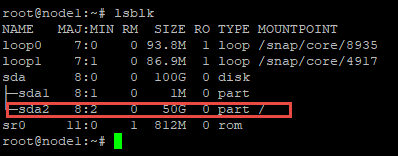
Note: We use “lsblk“ command to show block of partitions of this server which it shows it has two sda1 and sda2 that sda1 is for boot partition and sda2 is for root partition “/“. Show file System of the Servers
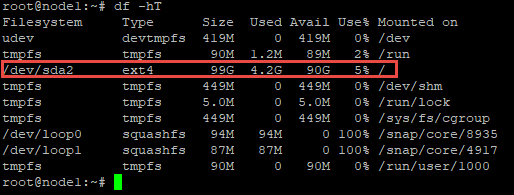
# df -hT
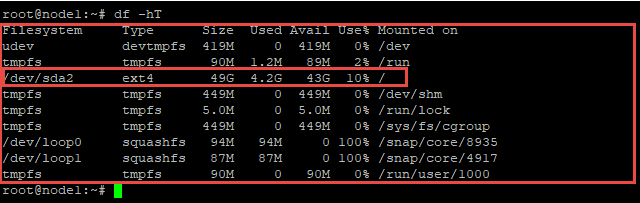
Note: We use “df -hT“ to show file system of the Server that we easy to extend to root partition and server file system is “ext4”.
III. Extend Root Partition
1. Extend Disk for Server
To process this project, we have to extend for disk of our server, and we extend to root partition. For example, this server disk is “50GiB” and we extend it to “100GiB“. After we extend disk, we have to verify the disk storage of server. To check server disk:
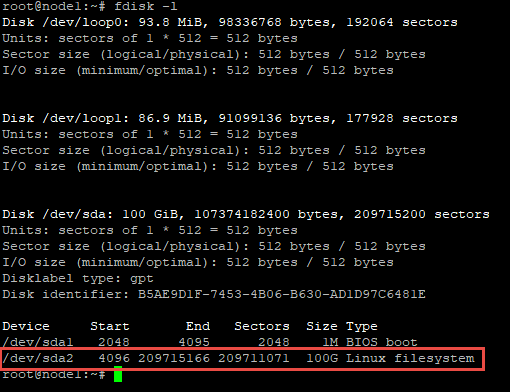
# fdisk -l
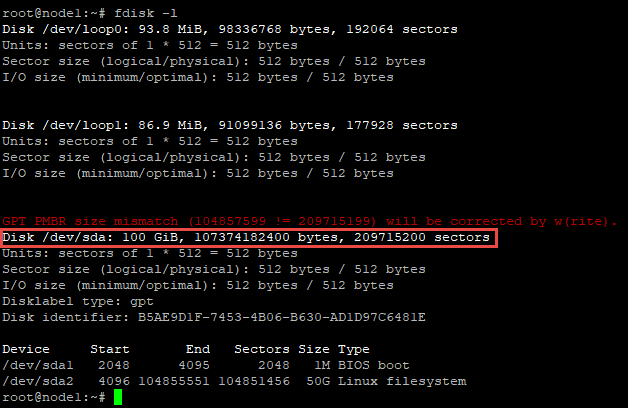
Therefore, total disk of server is 100GiB now, and we can extend for root partition.
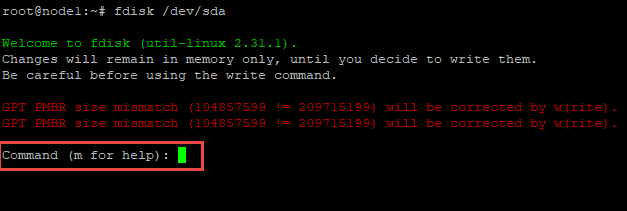
2. Extend Root Partition
# fdisk /dev/sda
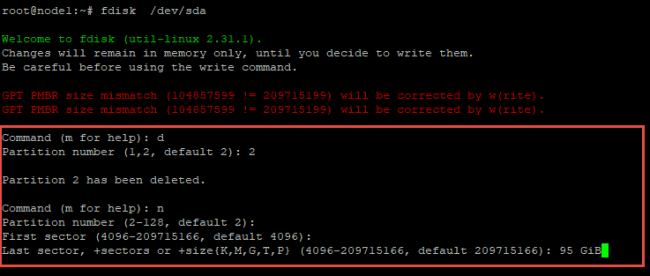
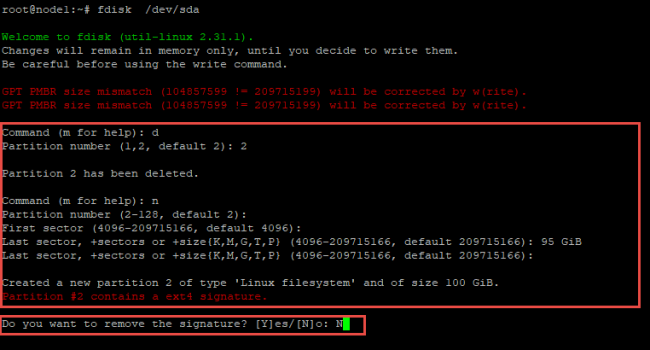
We can delete the signature of create partition if you want.
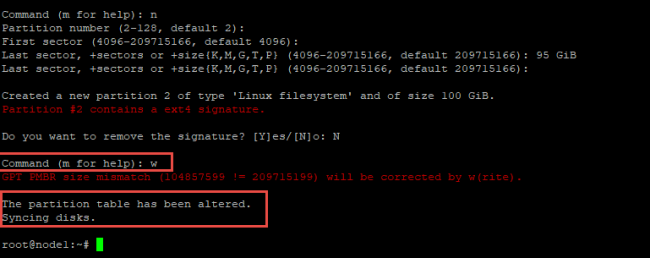
# partbropbe
# resize2fs /dev/sda2
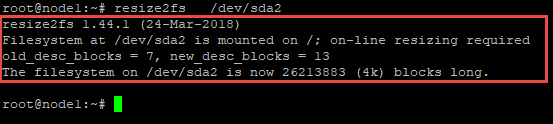
IV. Verify and Check of Configuration
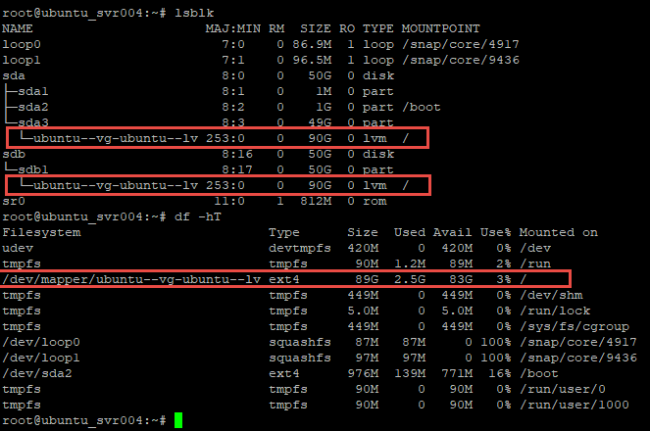
To verify, show block of petitions:
# lsblk
 – Show file System of the Servers
# df -hT
 – Show detail of server partitions
# fdisk -l
I. Introduction
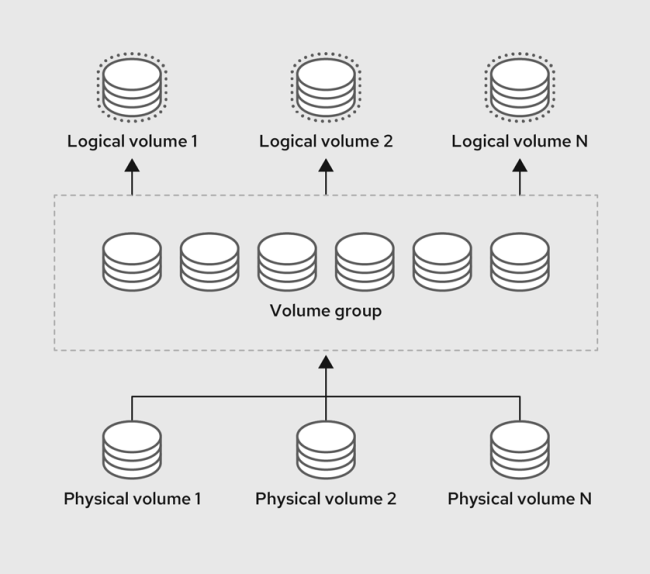
Logical Volume Management (LVM) is a management technology of storage device that gives users the power to pool and abstract the physical layout of component storage devices for easier and flexible administration. Utilizing the device mapper of Linux kernel framework, the current iteration LVM2 can be used to gather existing storage devices into groups and allocate logical units from the combined space as needed.
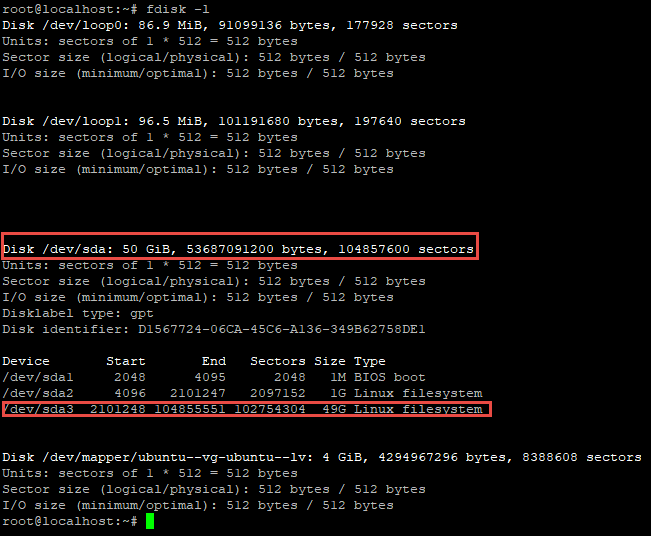
# fdisk -l
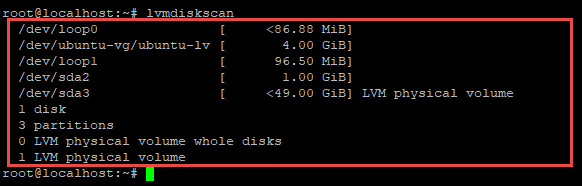
# lvmdiskscan
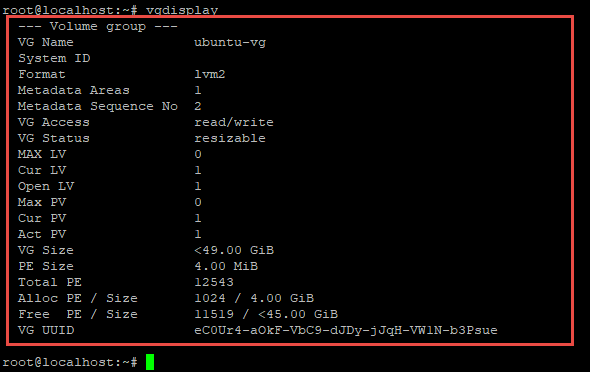
# vgdisplay
# pvscan
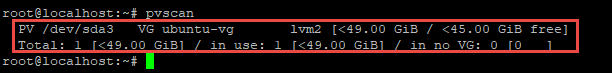
# pvdisplay
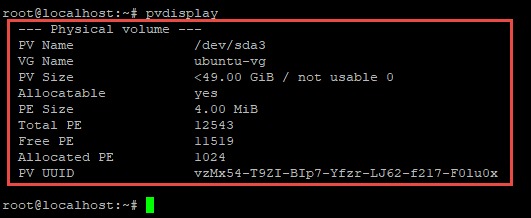
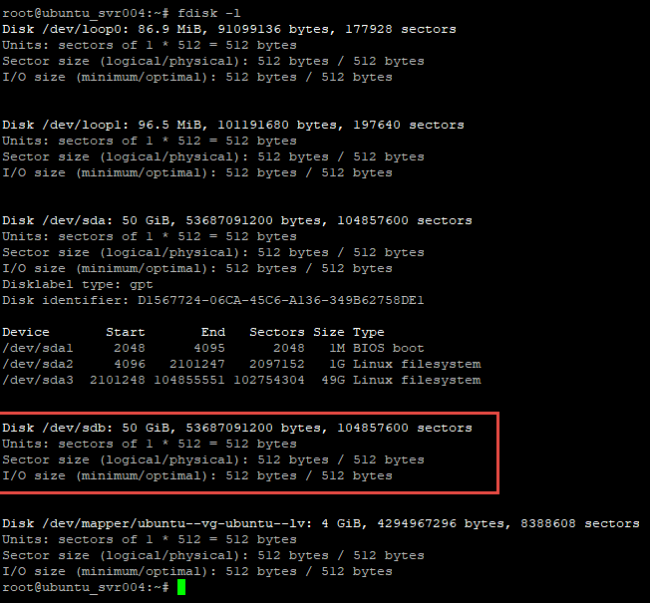
# fdisk -l
# lvmdiskscan
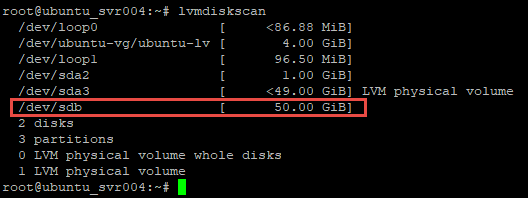
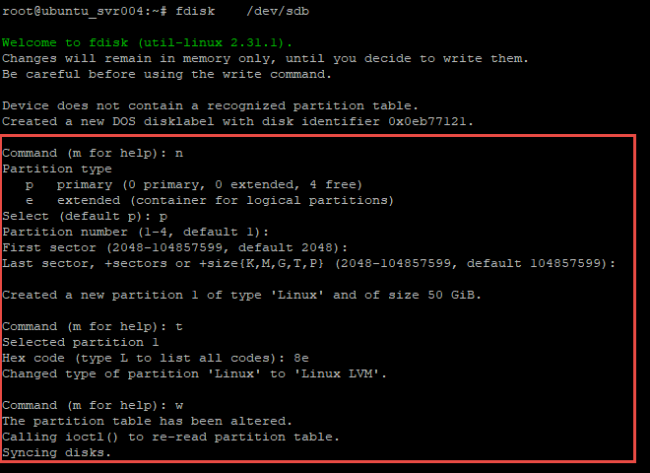
# fdisk /dev/sdb
– “p” (chose for Primary Partition)
– “Press Enter” (Default Partition Number)
– “Press Enter” (Default Space)
– “t” (Change File System Format)
– “8e” (Chose for “LVM” Format)
– “w” (Write Partition)
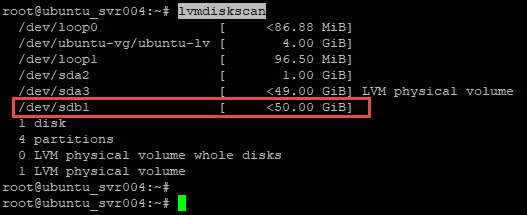
# lvmdiskscan
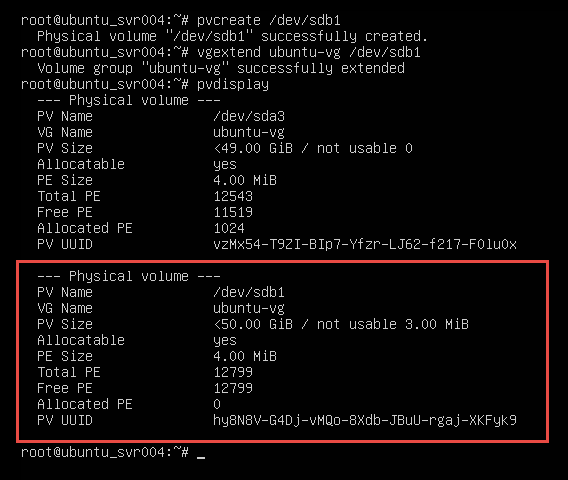
# pvcreate /dev/sdb1
# vgextend ubuntu-vg /dev/sdb1
# pvdisplay
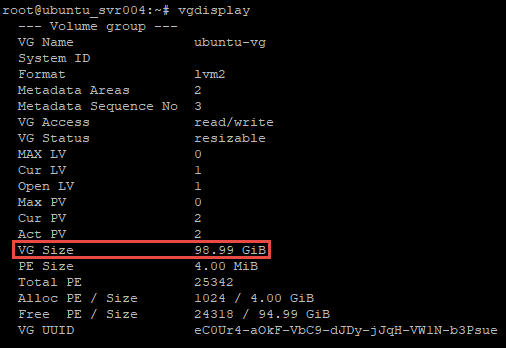
# vgdisplay
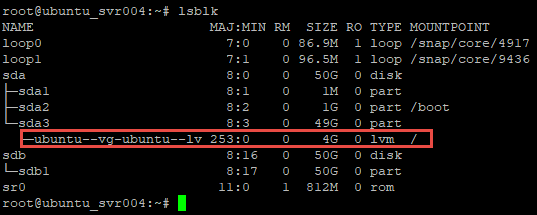
# lvexten –L 90G  /dev/ubuntu-vg/ubuntu-lv
# resize2fs /dev/ubuntu-vg/ubuntu-lv
# lsblk
# df -hT
I. Introduction
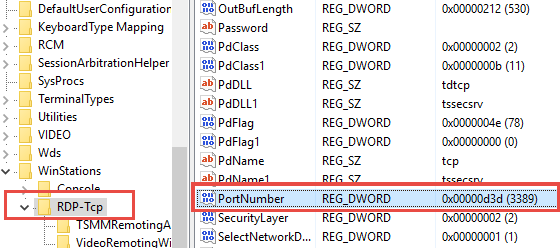
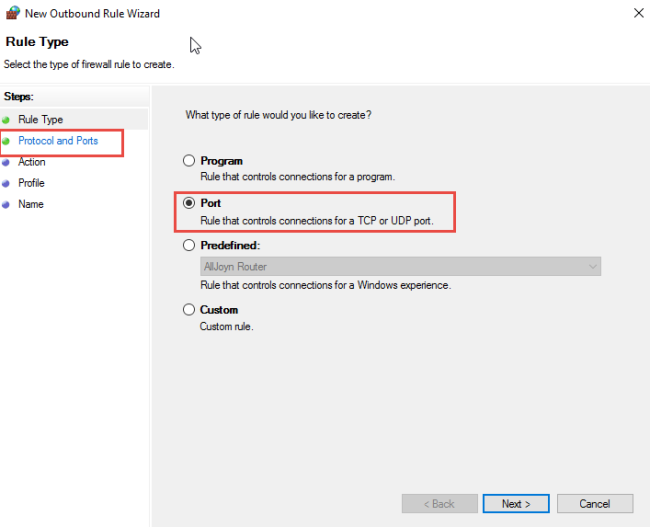
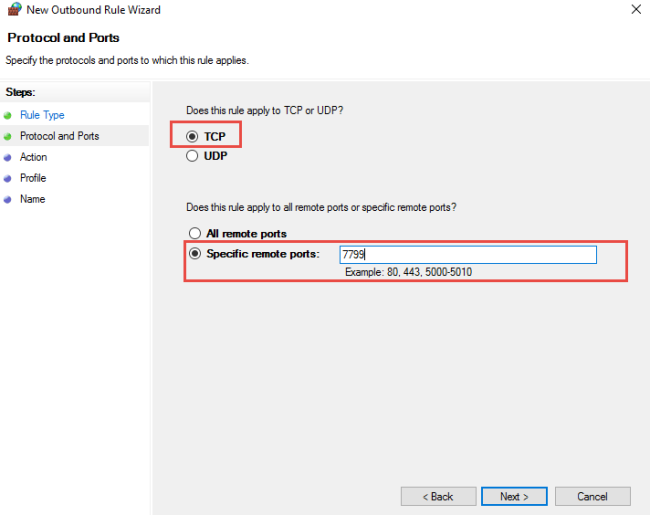
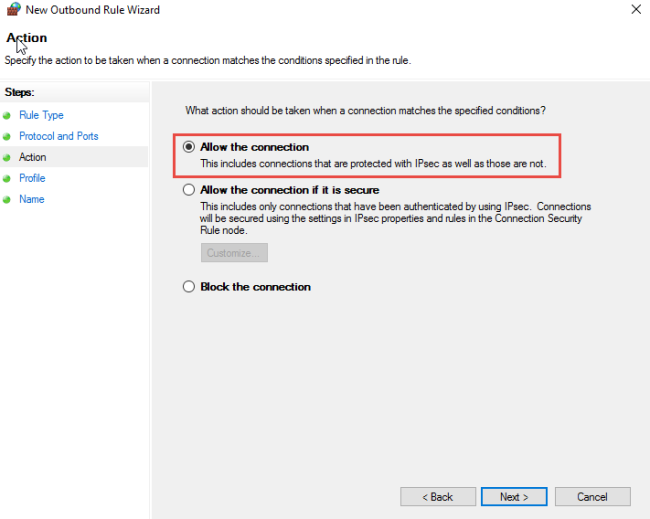
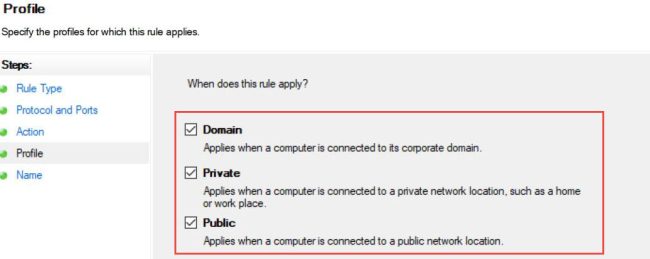
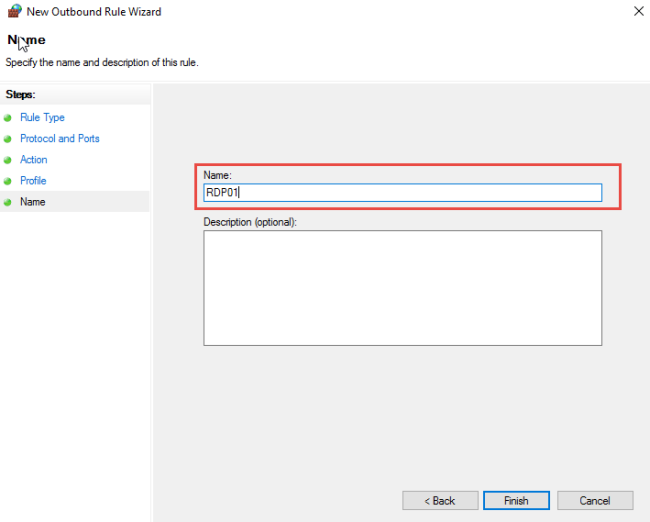
When we connect to Windows Server through the Remote Desktop client, the Remote Desktop feature on our computer listens to the connection request through a defined listening port (3389 by default). We can change that listening port on Windows Server by modifying the registry.
II. Processing and Scenario
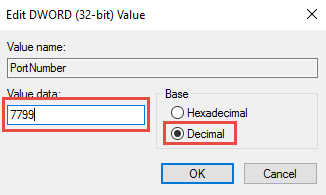
This Server is Window Server 2016 Standard, and we are going to Remote Desktop default port number 3389 to 7799.
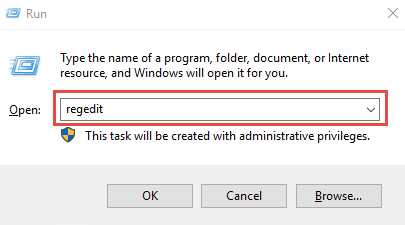
1. Check Registry Editor in Window Server
To check Registry Editor
– Go to “Run” and types “regedit”
I. What is Root?
Root User: The root user is the superuser account on Linux systems, possessing unrestricted access to all commands and files. It can perform any action, including changing system files, managing user accounts, and installing software.
II. Security Concerns
– Brute Force Attacks: Allowing root login can expose the system to brute force attacks where attackers attempt to guess the root password.
– Accidental Changes: Operating as root increases the risk of making accidental changes that could harm the system.
– Malware Risks: If an attacker gains root access, they can execute any command, potentially installing malware or compromising data.
III. Here are the steps to secure root login
Method 1: Disable Root Login via SSH
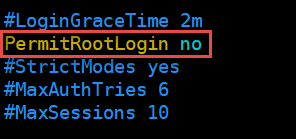
– Open the SSH Configuration File
$ sudo vi /etc/ssh/sshd_config
– Look for the line that says PermitRootLogin. If it’s commented out (with a #), uncomment it and change from “#PermitRootLogin yes” to “PermitRootLogin no“:
– Restart the SSH service to apply the changes:
$ sudo systemctl restart sshd
Method 2: Lock the Root Account
– You can lock the root account to prevent login:
$ sudo passwd -l root
Method 3: Disable Root Login via Console
– Open the /etc/passwd file:
$ sudo vi /etc/passwd
– Change the shell for the root user from /bin/bash to /sbin/nologin:
root:x:0:0:root:/root:/sbin/nologin
– Save the changes and exit the text editor.
To check Real-Time of CPU and Memory usage of Linux server. Here are some of the most commonly used methods:
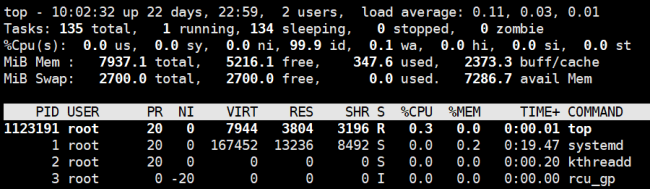
I. top command
The top command is super useful for monitoring what processes are using the most CPU and memory on your Linux system. It gives you a dynamic real-time view that updates frequently to show any changes.
$ top
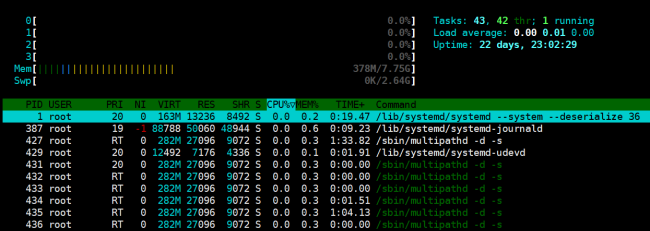
II. htop command
The htop command is an interactive process viewer for Unix systems. It provides a real-time, colorful representation of system processes, CPU usage, memory usage, and other system resources that’s like an upgraded top version.
$ htop
Depending on your Linux distribution, you can install htop using the package manager:
Debian/Ubuntu:
$ sudo apt install htop
CentOS/AlmaLinux/RHEL:
$ sudo yum install htop
Fedora:
$ sudo dnf install htop
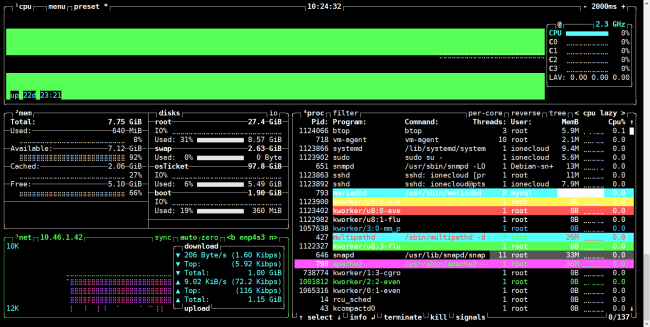
III. btop command
The btop is an advanced system monitoring tool that provides a visually appealing and user-friendly interface for monitoring system resources, such as CPU, memory, disks, and network usage. It is an upgrade over other monitoring tools like top and htop, with a modern look and additional features.
$ btop
You can install btop using package managers or by building it from source. Here are the installation commands for various Linux distributions:
Debian/Ubuntu:
$ sudo apt install btop
Fedora:
$ sudo dnf install btop
CentOS/AlmaLinux/RHEL:
Step 1: Install Dependencies
Before installing btop, ensure you have the necessary development tools and libraries
$ sudo dnf groupinstall "Development Tools"
$ sudo dnf install cmake git
Step 2: Download and Build btop
– Clone the Repository:
$ git clone https://github.com/aristocratos/btop.git
– Build btop:
$ cd btop
$ make
– Install btop:
$ sudo make install
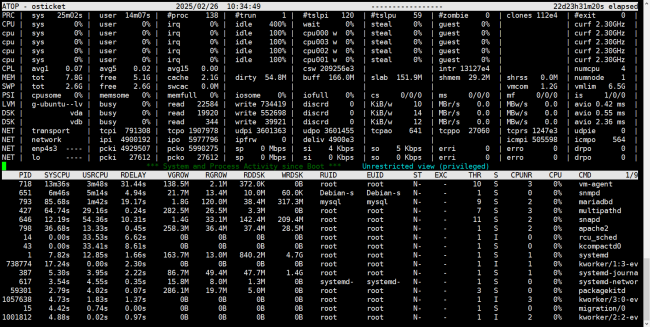
IV. atop command
The atop is an advanced system and process monitor for Linux that provides detailed information about system resource usage, including CPU, memory, disk, and network. It offers a comprehensive view of system performance and is particularly useful for performance tuning and troubleshooting.
$ atop
To install atop on various Linux distributions, you can use the following commands:
Debian/Ubuntu:
$ sudo apt install atop
CentOS/AlmaLinux/RHEL:
$ sudo yum install atop
Fedora:
$ sudo dnf install atop
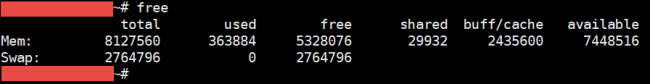
V. free command
– The free command is a simple but useful tool in Linux for displaying information about system memory usage. It provides a summary of the total, used, free, shared, buffer/cache, and available memory on the system.
– When you run the free command without any options, it provides details about the total, used, and free physical and swap memory on your system.
$ free
Common Options
– Show the output in a human-readable format (e.g., in MB or GB):
$ free -h
– Display memory usage in megabytes.
$ free -m
– Display memory usage in gigabytes.
$ free -g
– Continuously display memory usage at specified intervals (in seconds).
$ free -s 5
This command will refresh the output every 5 seconds until interrupted.
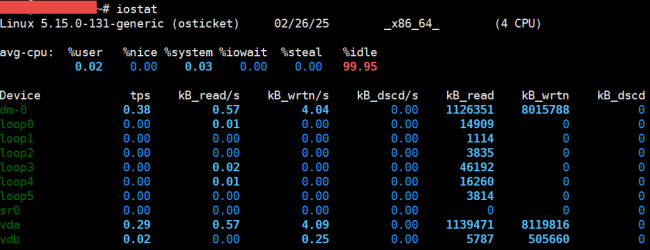
VI. iostat command
– The iostat command reports statistics about disk input and output operations and CPU utilization on Linux systems.
– It’s useful for monitoring disk performance and throughput. This will help identify high disk utilization.
– Generally, below 60% CPU idle time means potential cpu CPU-constrained disk throughput. And increasing Busy% or long ServiceTime may indicate a struggling drive.
$ iostat
To install iostat on various Linux distributions, you can use the following commands:
Debian/Ubuntu:
$ sudo apt install sysstat
CentOS/AlmaLinux/RHEL:
$ sudo yum install sysstat
Fedora:
$ sudo dnf install sysstat
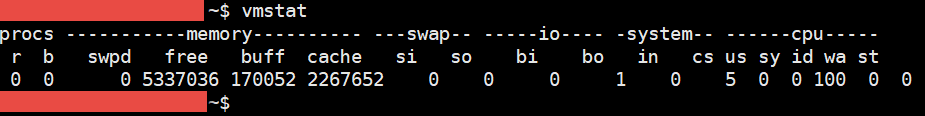
VII. vmstat command
The vmstat command (short for “virtual memory statistics”) is a command-line utility in Linux that reports information about processes, memory, paging, block I/O, traps, and CPU activity. It provides a snapshot of system performance and can be useful for monitoring and diagnosing performance issues.
$ vmstat
To monitor network traffic in Linux, you can use several command-line tools. Here are some of the most commonly used commands:
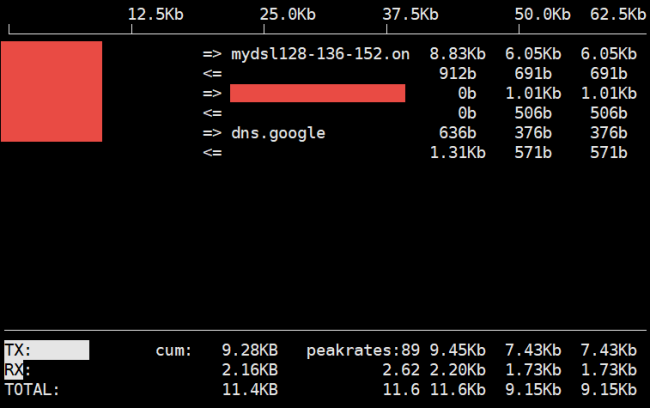
I. iftop command
The iftop command is super useful for monitoring network usage and bandwidth in real-time. It displays a table of the connections and traffic going through your network interfaces much like the top displays process activity. iftop makes it easy to identify bandwidth-hungry applications, unusual traffic spikes indicating issues and general network usage patterns.
This will automatically detect interfaces and start monitoring live traffic through them. It shows:
– Instantaneous bandwidth rates.
– Total data transferred.
– Host IPs are sending/receiving the most data.
– Network connection peer hosts.
– You can also filter by IPs/protocols or limit monitoring to specific interfaces.
$ iftop
 To install iftop on various Linux distributions, you can use the following commands:
Debian/Ubuntu:
$ sudo apt install iftop
CentOS/AlmaLinux/RHEL:
$ sudo yum install iftop
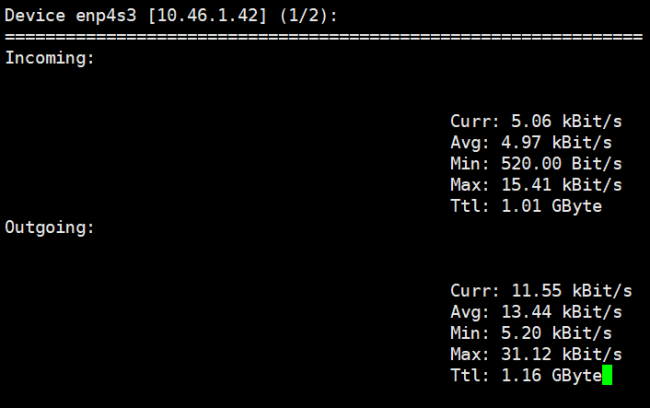
II. nload command
The nload is a command-line tool for monitoring network traffic and bandwidth usage in real time. It provides a visual representation of incoming and outgoing traffic, making it easy to see how much data is being transmitted over your network interfaces.
$ nload
To install nload, you can use the following commands based on your Linux distribution:
Debian/Ubuntu:
$ sudo apt install nload
CentOS/AlmaLinux/RHEL:
$ sudo yum install nload
Fedora:
$ sudo dnf install nload
To check Disk Partitions and Disk Space on Linux, we would like to recommend you four commands:
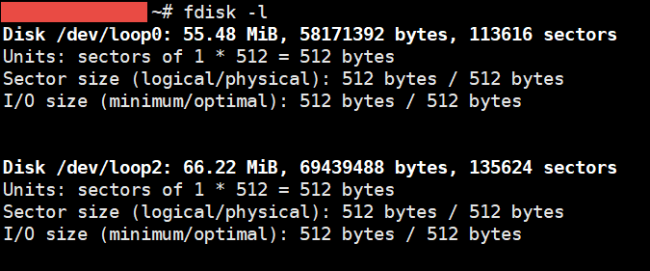
I. fdisk command
The fdisk command is a powerful utility in Linux used for managing disk partitions. It allows users to create, delete, resize, and manipulate disk partitions on a hard drive. fdisk works primarily with MBR (Master Boot Record) partition tables.
Each hard disk which in LINUX which disk label as MBR allows only create 4 primary partitions, or 3 primary and 1 extended partition with 12 logical partitions.
Command allows to list hard disk and partition:
$ fdisk -l
Once inside the fdisk interactive prompt, you can use the following commands:
– m: Display help menu with a list of commands.
– p: Print the current partition table.
– n: Create a new partition. You’ll be prompted to specify the partition type (primary or extended), partition number, and size.
– d: Delete a partition. You’ll need to specify the partition number to delete.
– t: Change a partition’s system ID (type). You need to specify the partition number and the new type.
– a: Toggle a bootable flag on a partition.
– w: Write the changes to the disk and exit.
– q: Quit without saving changes.
Note:
– Backup Data: Always back up important data before modifying partitions, as wrong operations can result in data loss.
– Unmount Partitions: Ensure that any partitions you are modifying are unmounted.
– Use with Caution: fdisk can significantly affect your system’s disk layout, so use it cautiously.
II. gdisk command
The gdisk command is a partitioning tool used in Linux for managing GPT (GUID Partition Table) disks. It is similar to fdisk but is specifically designed to handle the newer GPT format, which allows for larger disks and more partitions than the traditional MBR (Master Boot Record) format.
In case gdisk command not found, please install follow command below:
For Almalinux/Fedora
$ dnf or yum install gdisk
For Ubuntu/Debian
$ apt install gdisk
To start gdisk, specify the disk you want to manage. For example, to work with /dev/vda, you would run:
$ gdisk /dev/vda
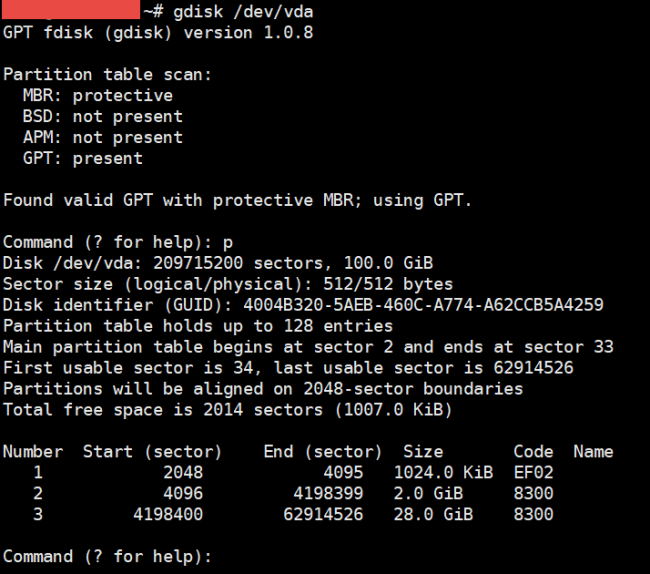
Once inside the gdisk interactive prompt, you can use the following commands:
– m: Display the help menu with a list of commands.
– p: Print the current partition table.
– n: Create a new partition. You’ll be prompted to specify the partition number, first sector, last sector, and partition type.
– d: Delete a partition. You’ll need to specify the partition number to delete.
– t: Change a partition’s type. You must specify the partition number and the new type code.
– a: Toggle a partition’s bootable flag.
– w: Write the changes to the disk and exit.
– q: Quit without saving changes.
III. parted command
Parted is a versatile command-line utility in Linux used for managing disk partitions. It supports both MBR (Master Boot Record) and GPT (GUID Partition Table) partitioning schemes and is suitable for a variety of tasks, including creating, deleting, resizing, and formatting partitions.
In case parted command not found, please install follow command below:
For Almalinux/Fedora
$ dnf or yum install parted
For Ubuntu/Debian
$ apt install parted
To start parted, specify the disk you want to manage. For example, to work with /dev/vdb, you would run:
$ parted /dev/vdb
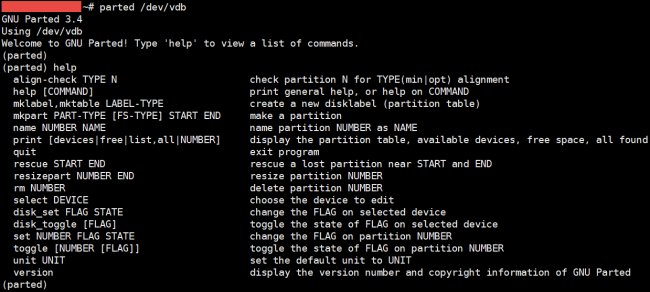
Once inside the parted interactive prompt, you can use the following commands:
– print: Display the partition table.
– mklabel: Create a new partition table (e.g., mklabel gpt or mklabel msdos).
– mkpart: Create a new partition.
– rm: Remove a partition.
– resizepart: Resize an existing partition.
– set: Change a partition’s attributes (e.g., boot flag).
– quit: Exit parted.
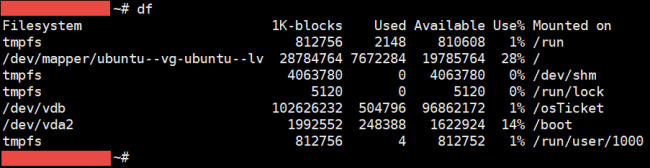
IV. df command
The df command in Linux is used to display information about disk space usage on mounted filesystems. It provides a summary of available and used disk space, helping users monitor storage usage on their systems.
$ df
Here are some useful options you can use with df :
– Display the sizes in a human-readable format (e.g., GB, MB)
$ df -h
– Display the filesystem type along with the disk space information
$ df -T
– Include all filesystems, even those with 0 blocks
$ df -a
– Show inode usage instead of block usage
$ df -i
– Display a total line at the end of the output showing the total usage.
$ df -h --total
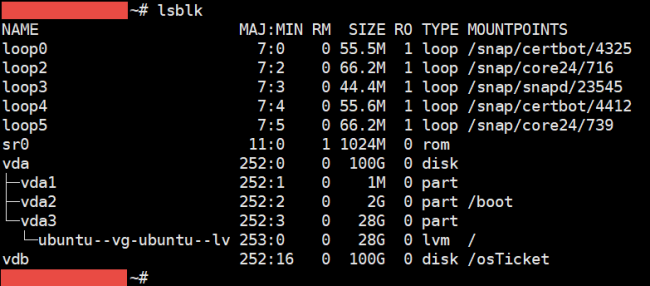
V. lsblk command
The lsblk command in Linux is used to list information about all available or specified block devices. It provides a clear and organized view of storage devices, including hard drives, SSDs, and their partitions, along with details such as sizes and mount points.
$ lsblk
Here are some useful options you can use with lsblk:
– Show all devices, including empty ones.
$ lsblk -a
– Show filesystem information, including the filesystem type and label.
$ lsblk -f
– Specify which columns to display. For example, to show only NAME, SIZE, and MOUNTPOINT:
$ lsblk -o NAME,SIZE,MOUNTPOINT
– Print the device names with full paths (e.g., /dev/sda instead of sda).
$ lsblk -p
– Display the devices in a tree-like format, showing the relationship between disks and partitions.
$ lsblk -tree
To check listening port in Linux Server we recommend you to user “netstat” command. The netstat command in Linux is a powerful networking utility used to display various network-related information, such as active connections, routing tables, interface statistics, and more.
Here are the option usage with “netstat” command:
$ netstat
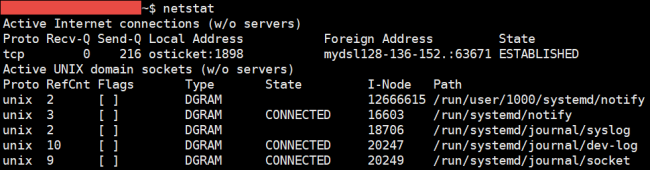
Here are some useful options you can use with netstat:
– Show all connections and listening ports.
$ netstat -a
– Display TCP connections.
$ netstat -t
– Display UDP connections.
$ netstat -u
– Show only listening sockets.
$ netstat -l
– Show numerical addresses instead of resolving hostnames.
$ netstat -n
– Display the routing table.
$ netstat -r
– Show network interface statistics.
$ netstat -i
– Display summary statistics for each protocol.
$ netstat -s
Clearing the cache, buffer, and memory in a Linux server can help free up memory and improve performance. However, it’s important to note that Linux uses available memory for caching to speed up processes.
Before clearing the cache, you can check your current memory usage with:
$ free -h
To clear the cache and buffers, you can use the following commands. These require root privileges, so prepend sudo as necessary.
– Clear PageCache only:
$ sudo sync; echo 1 > /proc/sys/vm/drop_caches
– Clear dentries and inodes:
$ sudo sync; echo 2 > /proc/sys/vm/drop_caches
– Clear PageCache, dentries, and inodes:
$ sudo sync; echo 3 > /proc/sys/vm/drop_caches
Here is we prepare a schedule to clear memory cache in Linux Server:
Step1: Create a shell script name as “clearcache.sh” under root (/root) partition with following commands
$ sudo vi /root/clearcache.sh
#!/bin/sh
sync; echo 3 > /proc/sys/vm/drop_caches
Step2: Set the permission of “clearcache.sh” script to 755
# chmod 755 /root/clearcache.sh
Step3: Edit the system crontab file using below command
# crontab –e
Step4: Enter the following line in crontab file to set cron job for clearing cache automatically
0 0 * * 0 /root/clearcache.sh
Note:
Append the above line, it is ruing at 00:00 every week.
Step5: Restart cron service to make it effect
/etc/init.d/crond restart
cPanel Web Hosting
Find helpful support documentation for your cPanel platform in this section.
I. Introduction
– We can create subdomains that separate from our main domain, which contains the Subdomains function in cPanel.
– Creating a subdomain in cPanel refers to the process of setting up a new subdomain
under an existing domain using the cPanel interface, a popular web hosting control
panel.
– A subdomain is a distinct part of a main domain that allows users to access different
sections of a website or create separate websites under the same domain (e.g.,
blog.example.com is a subdomain of example.com).
– Key Components of Creating a Subdomain in cPanel:
Subdomain Name: The prefix you choose to add to your existing domain (e.g., blog for blog.example.com).
Domain Selection: If you manage multiple domains in cPanel, you can select the one under which the subdomain will be created.
Document Root: The directory path on the server where the files for the subdomain will be stored, typically within the public_html folder.
DNS Management: cPanel often handles DNS automatically, but manual configuration may be needed if using external DNS servers.
File Management: After creation, you can upload and manage files specific to the subdomain.
II. Creating a Subdomain
Here is how you can process to create a subdomain:
Step 1: Log in to cPanel: Access your cPanel account using the URL provided by your hosting provider.
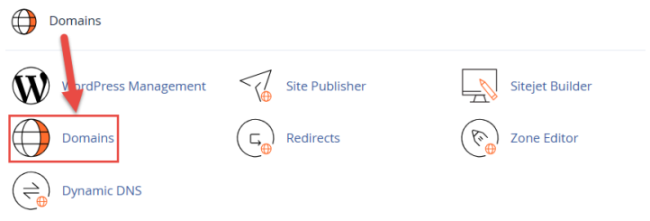
Step 2: Navigate to Subdomains: In the cPanel dashboard, locate the “Domains” section and click on Domain.
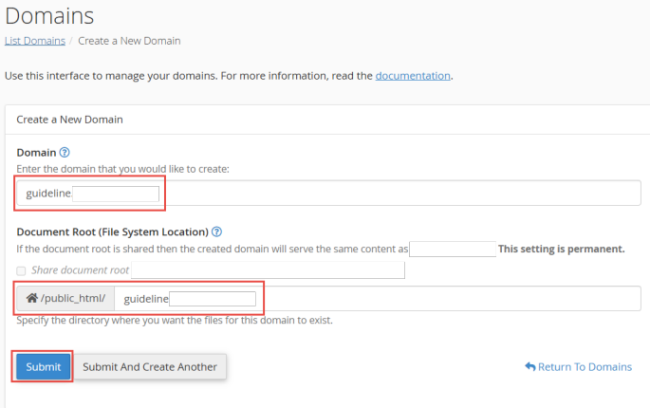
Step 3: Create a Subdomain:
– Click on Create A New Domain.
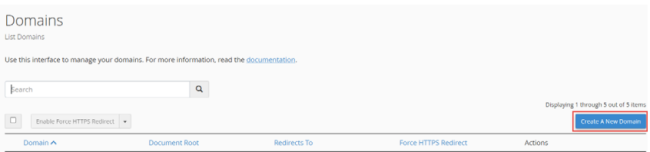
– In the Domain Field: Enter the name of the subdomain you want to create. Then Select the domain from the drop-down menu if you have multiple domains.
– In the Document Root: This is usually filled in automatically. It specifies the
directory where the subdomain’s files will be stored (e.g., public_html/blog).
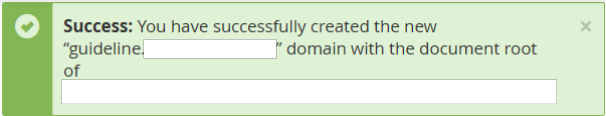
– Click the Submit button to process.
 – Check notification.
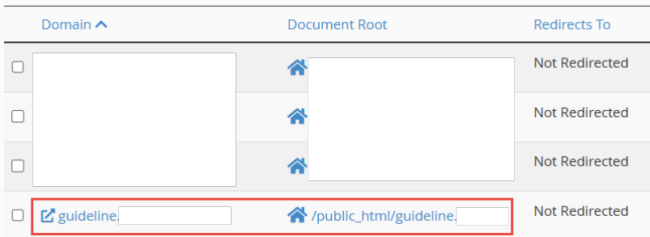
– After create success, it’ll show in domain list.
I. Introduction
Mysql Database offers a method for managing large amounts of information over the web easily. It is necessary to run many web-based applications such as bulletin boards, content management systems, and online retail shops.
![]()
II. Create or Delete a MySQL Database
1. Create a MySQL Database
To create Database in cPanel:
Step1: Log into “cPanel” and “locate Databases“.
Step2: Click “MySQL Databases“.
Step3: In the New Database field, type a name for the database.
Step4: Click “Create Database“.
Step5: Click “Go Back” and new database will appear in the Current Databases table.
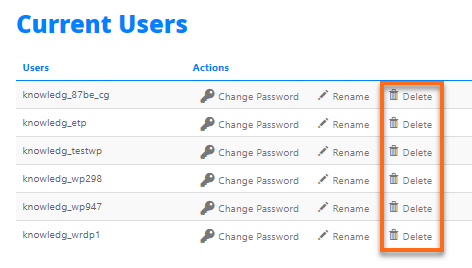
2. Delete a MySQL Database
To delete a MySQL Database:
Step1: Navigate to the “Current Databases“ section of MySQL Databases.
Step2: In the “Actions“ column of the table, click “Delete“ next to the database you wish to delete.
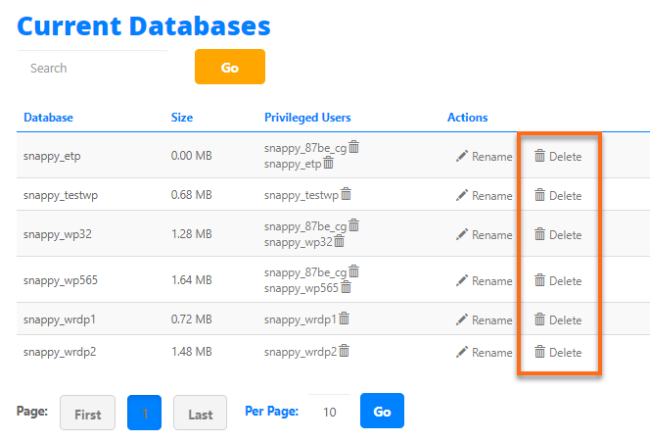
Step3: Confirm that you wish to permanently remove the database.

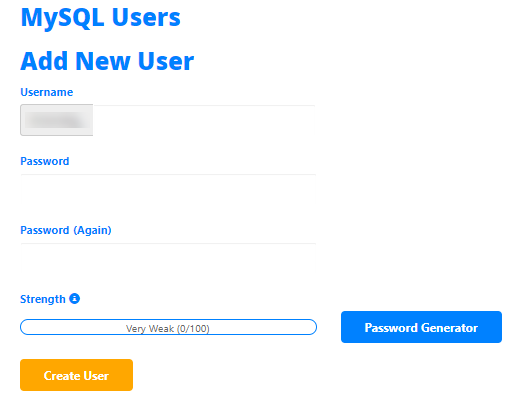
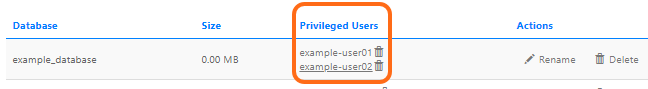
III. Create or Delete a Database User
MySQL user is a record in the MySQL server created for authentication purposes. This is different from the usernames that we use in logging into Windows or even in cPanel/WHM. Setting up a MySQL user provides more security to website’s databases as we can assign permissions to each user. The website’s owner does not need to grant just any user all access to their databases.
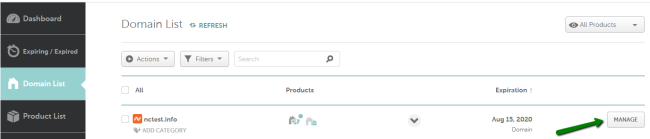
To change the nameservers for your domain, you will need to do the following:
Step1: Sign in to your “Namecheap“ account.
Step2: Select “ Domain List” from the left sidebar and click the “Manage” button next to your domain.
Step3: Find the “ Nameservers” section and select your preferred option from the drop-down menu. Click on the “green checkmark” to save the changes.
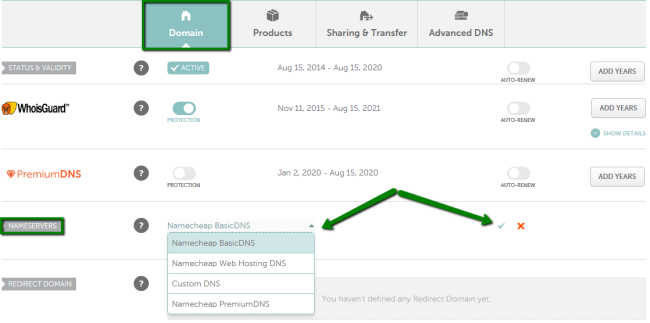
You can choose from four possible options:
1. “Namecheap BasicDNS“ if we want to point domain to default nameservers:
– dns1.registrar-servers.com
– dns2.registrar-servers.com
2. “Namecheap Web Hosting DNS“ if you have a shared hosting plan with “namecheap.com“ and want to point your domain to hosting nameservers:
– dns1.namecheaphosting.com
– dns2.namecheaphosting.com
3. “CustomDNS“ if you want to point your domain to custom nameservers (for example, your Personal DNS servers or third-party hosting nameservers if your domain is hosted with another DNS provider). You will need to fill in your hosting nameservers to the empty lines and click on the “green checkmark“ to save the change.
Example: ns1-2.nameserver.com

NOTE:
It’s required to enter the nameservers in the ns1.example.tld format, if you enter the IP addresses instead, the system will not accept this. Thus, if you were provided with both the nameservers and IP addresses, only the nameservers should be inserted as custom nameservers.
4. “Namecheap PremiumDNS” is a paid DNS service that can be used with any domain registered at any registrar. This option will be available for the domains that have a “PremiumDNS“ subscription attached
NOTE:
– If you change nameservers from Custom nameservers to default ones or vice versa, the host records will not be added to the new nameservers automatically. Please make sure to save all the needed settings and set them up manually after the nameservers switch.
– Nameservers changes do not propagate instantly. Once your nameservers are changed, it may take up to 24 hours (more, in rare cases) for local ISPs to update their DNS caches so that everyone can see your website.
– You can always check your domain name using any Proxy server as Proxy servers do not store cache, thus you can see the non-cached information.
Get in Touch
iOneCloud prides itself with providing our customers class-leading, courteous customer service – 24/7. Please feel free to give our iOneCloud team a call today.

iOneGPT
You will receive a swift answer.
Give us a call
From Monday to Friday 8:30am to 5pm.
Send us an email
We will get back to you in no time.
Send us a message
Contact us today and our friendly iOneCloud sales staff will reach out as soon as possible.